

 How to Read Marine Navigation Charts – A Complete Guide for Mariners">

Check the chart legend and scale first to anchor your plan. There, planning begins as you read depths and flag grounding risks early, and thats why you stage the crew for the next steps before you enter confined waters.
There are multiple navigational chart types you will use, from paper sheets to digital ENCs, and their indicators point to depth, shoals, and navigational hazards. Use methods that cross-check with tidal data and AIS reports to improve accuracy and maintain situational awareness across groups of vessels in the same area.
Knowing the symbols on a chart is not enough; you must read their context, connect the lines of position, and interpret how depth contours shift with the tide to reveal the deeper hazards. The navigational cues you rely on include contour lines, soundings, danger marks, and obstruction symbols, all of which serve as indicators for safe routing.
Consult the chart manual and the vessel’s needs for planning. Your skills to interpret symbols, verify positions with check against known fixes, and maintain redundancy by cross-checking with the latest notices to mariners should be practiced daily. Access to these resources should be coordinated with their ops teams to ensure rapid access to updates.
In the final checks, verify your position, confirm that your route avoids shallow areas, review tide windows for deeper water, and ensure you have access to up-to-date notices. This approach helps you connect chart data with actual conditions and reduces the risk of grounding.
Q: How to read position on a nautical chart
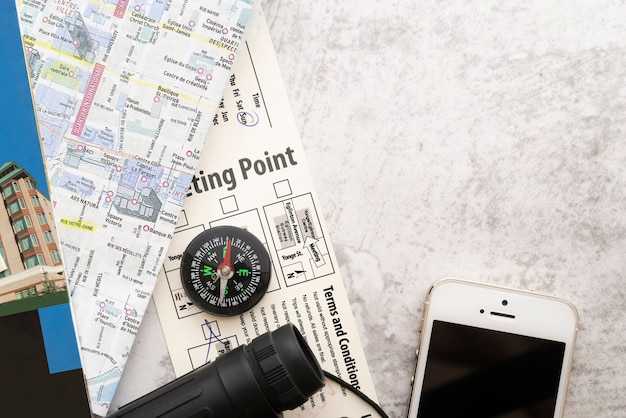
Plot your position on the chart by intersecting two independent lines of position (LOP) and confirm with a third reference to keep the fix credible. Use a canada-approved, standardized chart and the basics of plotting with latitude/longitude graticules visible on the map.
Typically, you gather fixes from GPS, radar, and bearings from visible landmarks, then compare them while planning a travel leg. Record the intersection and plot the result on the chart so you can see where you stand relative to hazards, channel, and nearby vessels.
Read the chart variation and apply the compass deviation to convert bearing to true. This step reduces errors in your lines when you plot a course or a position for navigation through busy traffic and constrained waters.
Note hazards, shoals, wrecks, and the channel layout around you. Mark a ring around the plotted position to indicate estimate uncertainty; on some charts, wavves along the coast show coastal features. Maintain situational awareness as conditions change, and use another reference if you lose a fix.
Choose the right scales for the area: small-scale charts cover broad regions, while larger scales give detail in harbors and channels. Check the year of the edition and any notices to mariners, and keep education current to avoid overload when local conditions vary or another chart source becomes available through updates.
Pinpoint position using latitude and longitude on the chart
Plot your position using latitude and longitude on the chart to the nearest minute, then verify with landmarks and tides to ensure a safe fix.
-
Identify latitude and longitude on the chart. Latitude lines run east–west and are labeled north or south; longitude lines run north–south and are labeled east or west. Note the degrees and minutes, and use the reference grid shown on the chart to locate the exact point in the earth’s grid. This navigational step provides a reliable reference for your position.
-
Transfer the coordinates to the plotting area. Use a pair of dividers or a pencil with an inch-scale ruler to place a mark at the intersection of the chosen latitude and longitude. Keep the point precise and avoid rounding errors, which can compound travel mistakes on larger-scale charts designed for harbor and coastal navigation.
-
Cross-check with landmarks along the coast. Compare the plotted position against recognizable features such as piers, breakwaters, or distinctive buildings. Landmarks help you confirm the fix and reduce drift, especially when tides and currents shift your apparent location.
-
Compare with tides, currents, and other reference data. If the chart shows predicted currents or tidal streams for the time of travel, adjust your fix accordingly. Use this comparison to validate whether your position aligns with the expected motion of the water column and shore features.
-
Consider chart scale and coverage. When close to shoals, wrecks, or shallow banks, switch to a larger-scale chart for greater precision. Larger-scale charts provide more markings, finer graduations, and clearer reference points that improve accuracy during sailing and near-coast work.
-
Record and verify with the chart’s source. Mark the time, lat/long values, and the corroborating features in your log, and note the reference markings and water depth in meters. If you use Canada-approved charts, follow Canada-approved guidelines and keep the reference in your navigator’s manual for future checks.
-
Maintain situational awareness at all times. Whether you are in the Americas or offshore, keep the fix updated as you travel and adjust your course to stay along safe routes. Use a steady routine to compare earth coordinates with known landmarks, tides, and currents, and rely on your manual plotting skills to avoid errors.
источник: navigational references and official hydrographic data, including blue navigational marks and green land features, support precise plotting. If the tide or current shifts, recalculate promptly to stay on course and continue sailing with confidence.
Interpret chart datum and projection to ensure accurate positioning
Always verify the chart datum before plotting your position and confirm the projection used on the chart you plan to use for planning. The datum provides the vertical reference for depths and the projection defines the horizontal grid; a mismatch causes misalignment between measured positions and plotted coordinates, increasing grounding risk near the coast during every tide cycle.
To identify the correct values, check the chart margins for datum notes and the projection name, and compare with the reference in your manual or office guidance. When you work with harbors, marinas, or coastal routes, the margin notes and metadata will tell you the exact vertical reference and the grid system. Before you start, gather the details and ensure your plotting method aligns with the chart’s system and the GPS reference you rely on for return positions on the bridge chart table.
| Aspect | What to verify | Impact on plotting |
|---|---|---|
| Datum | Chart datum (for depths) such as MLLW or another vertical reference | Depths shown on the chart are referenced to this surface; adjust with tides and local conditions to prevent misreads near grounding points |
| Proiezione | Grid type (Mercator, Transverse Mercator, etc.) used by the chart | Affects horizontal distances and angles; errors grow with distance from the equator and with large course legs |
| Includes | Margin notes and reference sheets in the manual | Helps you identify the exact datum and projection quickly if you need to re-check between plots |
Think of this as a routine check before every maneuver: confirm the side of the vessel you’ll use, verify depths along the channel, and compare with GPS reference data. The process should feel natural when you plan routes through busy harbors or sheltered marinas; the consistency across systems helps you plot accurately and avoid dangerous misalignments.
Fix position: cross-bearings, radar intersection, and AIS checks

Take a fix by cross-bearings from two fixed landmarks and plot them on the charts to locate exactly where you are. This approach works in any light and provides a reliable reference you can compare with radar and AIS results.
Cross-bearings involves selecting two landmarks that appear on the chart with precise positions, taking true bearings from the observer’s position, and drawing corresponding lines on the chart. The intersection gives your position within about 0.2–0.5 NM in calm seas; expect larger error in heavy seas or with poor landmarks. If you cannot obtain two bearings, mark the uncertainty area and proceed with radar or AIS checks to tighten the fix.
Radar intersection uses a confirmed radar target (land, beacon, or vessel) whose chart position you trust. Read bearing and range, plot the line from your vessel on the chart corresponding to that bearing, and identify the intersection with the other line from the second landmark. Use two targets when possible to reduce error. Keep range rings at 0.5–2 NM on the display to match chart scale, and account for radar-originating errors and ship movement. If the target shares the same contour area, the intersection narrows to a single plot, making the fix easier.
AIS checks: compare the AIS-reported position, course, and speed with your own fix. If the AIS position lies within 0.2–0.5 NM of the plotted fix, you have an informed fix; larger differences (0.8–1.0 NM) require re-checking bearings and replotting. Verify the target’s identity and MMSI to ensure they match the vessel you expect, and watch for false targets near anchorages or during departure in busy channels. AIS data provides a quick cross-check, but it depends on GPS and horizon visibility.
Tenuta dei registri e pratica: mantenere un elenco delle tre fonti di dati sulla posizione (источник): rilevamenti incrociati, radar, AIS. La regola generale è quella di utilizzare almeno due metodi indipendenti per confermare una posizione, quindi un terzo controllo se ci si avvicina ad aree critiche come ancoraggi o rotte di partenza. Durante il calcolo, confrontare i rilevamenti incrociati, l'intersezione radar e i risultati AIS con i contorni della carta e le aree di profondità per confermare la coerenza. Il processo facilita i tracciati sulle carte e amplia la comprensione, in modo da poter agire rapidamente se compare una discrepanza, ad esempio vicino a boe bianche o in acque basse.
Leggere chiaramente le linee della griglia, i meridiani e i formati delle coordinate
Scegli un unico formato di coordinate (DDM, DMS o DD) e utilizzalo costantemente per la tracciatura. Imposta la tua carta elettronica su quel formato o annotalo sul foglio di tracciatura, quindi leggi le linee della griglia e i meridiani con un metodo coerente. Latitudine e longitudine appaiono lungo i margini; registra i gradi, i minuti e i secondi esatti (o decimali) a ogni intersezione della griglia. Se una fonte utilizza un formato alternativo, convertilo prima di tracciare per evitare errori. Questo approccio è necessario per la sicurezza e può essere considerato una best practice perché riduce le letture errate e ti mantiene allineato in sicurezza; il formato che usi è seguito in tutta la carta, quindi la velocità di lettura migliora. Considera la sicurezza durante l'addestramento e la legenda e la rosa dei venti seguono lo stesso sistema di riferimento, garantendo che la comunità utilizzi un metodo uniforme su cui fanno affidamento per ogni viaggio.
Leggi le linee della griglia seguendo gli intervalli etichettati sul bordo della carta. Le scale indicano la distanza; le scale marine comuni si convertono in metri o miglia nautiche. Utilizza la barra della scala o il righello elettronico per tradurre la distanza sulla carta nella distanza reale in acqua. Ciò comporta l'interpretazione delle forme dei simboli alle intersezioni – profondità, bassifondi, rocce, relitti – e la notazione delle loro posizioni rispetto alla tua rotta. I pericoli vicino a basse profondità richiedono di verificare le letture di profondità dai sondaggi prima di procedere. Comporta il controllo incrociato con i marcatori radar e i punti di riferimento per ridurre la deriva e gli errori di lettura. I gruppi di punti di riferimento attorno ai porti spesso seguono uno schema standard; conoscere lo schema accelera il tracciamento. La griglia segue uno schema prevedibile, il che velocizza ulteriormente il tracciamento.
I meridiani corrono in direzione nord-sud; la longitudine aumenta verso est. Il meridiano fondamentale è a 0°, con le altre linee etichettate in gradi e minuti. Sulle carte elettroniche, abilita la sovrapposizione della griglia per confermare l'allineamento con i meridiani; sulle carte cartacee, leggi i margini dove compaiono i numeri. Conoscere l'origine della griglia ti aiuta a localizzare rapidamente una posizione, specialmente quando devi convertire in un formato diverso come UTM o MGRS; è qui che entrano in gioco le coordinate basate sui metri, spesso utilizzate nelle acque costiere e negli approcci portuali per semplificare il riferimento incrociato con i sistemi elettronici. Considera come i meridiani si allineano con la rotta della tua imbarcazione e segui la stessa griglia durante tutto il viaggio per rimanere coerente.
I formati delle coordinate variano: lat/long in gradi e minuti, gradi decimali o formati basati su griglia come UTM/MGRS. Stabilisci il formato che userai per i log e il tracciamento, quindi attieniti a quello. Per convertire DMS in gradi decimali, somma gradi più minuti/60 più secondi/3600; per DDM in decimale, somma minuti/60 ai gradi. Registra il valore finale con l'indicatore dell'emisfero corretto (N/S ed E/W). Nei sistemi elettronici, verifica il risultato alternando i formati; questa pratica riduce le discrepanze quando si confronta con punti di riferimento noti all'interno della comunità e ti aiuta a leggere le carte in modo affidabile durante le operazioni notturne quando la luce è scarsa. In genere, vedrai i valori standard per gradi e minuti sulle carte, consentendo controlli incrociati rapidi e decisioni più veloci.
Verifica sempre incrociando punti di riferimento, luci e l'orientamento della rosa dei venti; questa pratica rafforza la fiducia nelle tue letture e supporta una pianificazione sicura. Conoscere le forme comuni dei simboli e il loro significato accelera l'interpretazione di profondità, scogliere e canali. Quando leggi le griglie, tieni gli occhi sulla rosa e sulle linee della griglia contemporaneamente; guadagnerai velocità mantenendo la precisione durante tutto il viaggio. Considera come la tua lettura delle carte si inserisce in un processo collaborativo più ampio all'interno della comunità e confrontati con il team di plancia per garantire che tutti rimangano allineati.
Traccia, verifica e registra un punto nave durante un viaggio
Eseguire un rilevamento iniziale della posizione nel momento in cui si lascia l'ancoraggio e verificarlo con almeno due sistemi indipendenti. Registrare ora, coordinate e metodo nel giornale di bordo per mantenere visibile la base di una pianificazione sicura mentre ci si muove in aree acquatiche sconosciute.
Riportare la latitudine reale, visualizzata sul display di navigazione principale, dal sistema principale. Quindi tracciare due linee di posizione (LOP) da fonti diverse. Le caratteristiche di ciascun metodo di correzione differiscono, quindi includere latitudine e longitudine, tipo di correzione, ora e una stima dell'errore. Utilizzare GPS, distanze radar da oggetti conosciuti, rilevamenti di luci ben visibili e osservazioni celesti, se disponibili, e registrare i risultati in una voce di registro standardizzata per garantire la coerenza.
Verificare le intersezioni delle LOP: le linee devono incrociarsi per produrre un'intersezione precisa. Se non convergono entro l'errore previsto, ricontrollare l'inserimento dei dati, cercare portate errate e correggere deriva o cambiamenti di marea. Mantenere decisioni informate valutando l'affidabilità di ogni fonte e come ciò influisce sulla posizione stimata pianificando la tratta successiva.
Registra la correzione nel giornale di bordo utilizzando un formato standardizzato: includi data/ora, latitudine/longitudine, tipo di correzione, fonti, stima dell'errore, riferimento alla carta nautica (anno di edizione) e se le coordinate mostrano il nord vero o magnetico. Aggiungi una nota sui progressi del tracciamento e su eventuali modifiche di rotta dalla correzione, soprattutto quando si entra in acque sconosciute o si pianificano ancoraggi.
Per la pianificazione dell'ancoraggio e il transito in aree trafficate o contese, confrontare i punti di riferimento con la carta nautica che mostra l'approccio al porto e la profondità dell'acqua. Le carte nautiche pubblicano avvisi e aggiornamenti annuali; verificare l'anno di edizione prima di affidarsi ai dati. Per le imbarcazioni che operano in queste acque, mantenere la consapevolezza delle caratteristiche dell'imbarcazione e dei limiti di navigazione e tenere informato l'equipaggio in modo che sia pronto ad adeguarsi al variare delle condizioni tra aree e stagioni.