

 Unlocking Tidal Waters – Harnessing Ocean Energy for a Sustainable Future">

Recommendation: Start with a 10 MW pilot of tidal-stream turbines in a protected inlet, providing clear performance data to guide the entire lifecycle of decisions. Thanks to modular turbines and a streamlined interconnection plan, you can scale toward 50 MW in five years, making the project feel effective and reliable for stakeholders. The site’s waves and water conditions inform turbine orientation, reducing wakes and boosting energy capture.
Historical benchmarks show feasibility at scale: La Rance in France began operation in 1966 with about 240 MW, and the Sihwa Lake plant in South Korea added about 254 MW. These installations demonstrate that a planned, data-driven approach supports grid integration, while an experiment in corrosion-resistant materials shows how lasting performance can be achieved.
Environmental planning must protect bottom-dwelling life and mangrove ecosystems. Design uses soft-bottom protections and robust monitoring to track sediment changes, water quality, and species responses. A site selection process that minimizes drains and disruptions in estuaries ensures turbines work toward benefiting the entire coastal zone.
Local benefits accrue when young engineers join the field, being empowered by hands-on training that accelerates progress. In places like the Hudson estuary, pilots test tidal devices and learn how to address safety when people are swimming near recreation zones. Clear signage, safety zones, and community programs help build trust, while creating local jobs and strengthening supply chains toward providing reliable energy to nearby towns.
To scale from pilot to broad deployment, an experiment-led plan tracks capacity factor, cost of energy, and reliability metrics. Design teams coordinate with drainage authorities to minimize drains during high tides and maintain healthy water flow. This approach fosters trust and accelerates adoption, directing resources toward resilient energy that respects ecosystems, especially soft sediments and mangroves, and supports coastal communities.
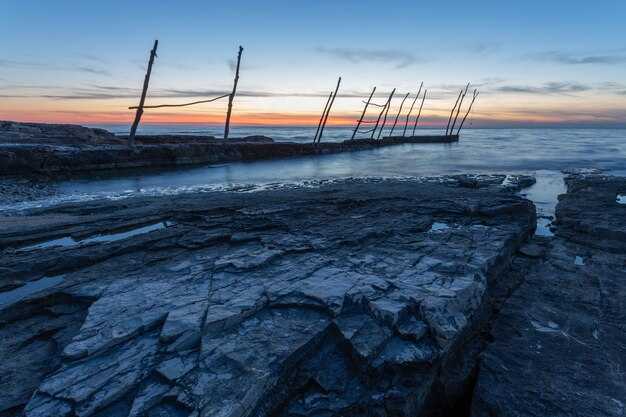
Practical pathways for tidal energy deployment and saltwater-lake fisheries
Begin with a 10 MW modular tidal array in a sheltered estuary where rivers meet a saltwater-lake system. This setup keeps the project less difficult to tackle, enables rapid learning, and reduces upfront risk. Use a robust weight-based mooring plan and a conservative line layout to withstand strong currents and seasonal floods. Co-deploy with local fisheries by establishing a joint monitoring program that tracks temperature, time of day, and fish activity, so operators can respond quickly to changing conditions; theyyll inform adjustments in operating windows and maintenance trips. Target large energy output while protecting favourite species; install fish-friendly screens with openings in the 20–50 mm range and design bypass paths for shrimp and crawfish where they migrate. Employ jigs and on-water surveys during trips to gather practical tips for targeting fish around turbine wakes, and tune turbine control to minimize disruption during peak feeding times. The strategy hinges on a data-driven decision loop–collecting biomass, current, and predator interactions keeps operations aligned with ecosystem needs. This step is critical for risk mitigation, and it helps the project scale over time.
Saltwater-lake fisheries pathways follow two tracks: first, scale toward 40–100 MW in brackish lagoons using modular turbines and fish-friendly screens; maybe staggered deployments to match fish migrations, almost year-round, where feasible. Second, establish a co-management framework that uses shared sensors and data to optimize both energy output and fishery access across systems. In practice, locate nearshore lagoons and river mouths where saltwater blends with freshwater, which naturally provides a predictable hydrology and a natural interface for fish, including shrimp, crawfish, and predatory species. Coordinate with rivers and lakes by aligning harvest seasons, known spawning times, and weather windows; use targeting plans based on temperature and time of day to set practical windows for gear and trips toward harvest. Commonly, fishers rely on jigs and other lure-based gear; knowing seasonal patterns and favourite spots helps adjust siting and timing. Monitoring data–catch counts, bycatch rates, and habitat conditions–supports a safer, more sustainable approach that benefits both energy systems and communities. There, proactive engagement and clear incentives help these pathways succeed.
Tidal resource assessment: site selection and resource mapping
Begin with a solid, data-driven site-screening like a strict filter that weeds out low-yield zones, then narrows to 3–5 candidate locations based on sustained current and suitable depth. Use long-term current data gathered from in-situ probes and remote sensing to estimate energy density, and pair it with bathymetry that supports secure gear installation. This initial pass should be fast and repeatable, so field teams can move from analysis to trips quickly when a site clears the threshold.
From the outset, build a simple yet solid knowledge base that relates hydrodynamics to installation practicality. Collect current profiles at multiple depths, seasonal signals, and near-bottom shear, then relate these to anchor options and scour risk. This approach keeps the focus on the metrics that drive performance and maintenance costs, and helps you compare sites in a consistent way. If a location lacks robust data, mark it for provisional monitoring rather than immediate inclusion in the final plan.
Site selection criteria combine three layers: hydrodynamics, geology, and logistics. In the hydrodynamic layer, prioritise zones with mean current speeds that sustain energy yield during spring tides, stable flow patterns, and limited low-speed pockets or reverse flows. In the geological layer, favour seabed types that support secure moorings and reduced scour while offering predictable construction windows. In the logistics layer, evaluate the ease of access for boats, the presence of rigs or existing infrastructure, and proximity to the grid, ports, or service hubs. A colour-coded colours map can help visualise these layers, with green for high-quality potential, yellow for caution zones, and red for unsuitable pockets.
- Site criteria: mean current speed at 20–30 m depth ≥ 1.8 m/s during peak tides; depth range 15–40 m; seabed that supports anchor spread without excessive scour.
- Infrastructure proximity: grid connection within 30–60 km, sheltered port access, and existing service routes for trips and resupply.
- Ecology and space use: avoid critical habitats and busy shipping corridors; account for ecological commotion during migratory periods and spawning seasons.
Resource mapping workflow follows a practical sequence. Gather existing bathymetric charts, tidal harmonics, and hydrographic data, then generate energy-density grids by integrating current magnitude with depth. Produce initial maps that show seasonal variability, using trip-based data to validate model predictions. Finally, filter to a shortlist and plan detailed field campaigns for verification.
- Data sources: national hydrographic offices, regional ocean models, and compliant in-situ ADCP (acoustic Doppler current profiler) deployments.
- Mapping outputs: energy-density grids, depth contours, substrate likelihood, and proximity to points of interest (ports, rigs, and grid connections).
- Validation steps: compare model estimates with at least two field trips per season to capture variability and confirm performance projections.
Field campaigns proceed with clear objectives. Use a staged approach: first deploy temporary instruments to capture spring-neap variability, then conduct focused boat-based surveys to map seabed types and potential anchorage zones. Keep gear robust and modular so you can test a few configurations within a single campaign. Trips should be scheduled to coincide with favorable weather windows and tide windows, reducing risk and increasing data yield. Use equipment that can be recovered and redeployed quickly to maximize the value of each trip.
- Instrumentation: ADCPs for current profiling, seabed augers or high-resolution sonar for substrate classification, and GNSS-based positioning for precise mapping.
- Deployment plan: staggered deployments to cover depth bands, with shared anchors and modular moorings where possible.
- Quality control: cross-verify profile data with buoyant reference measurements and repeat transects for consistency.
Ecology-aware assessment guides the interaction with living systems without slowing project progress. Identify anchor points where predatory species and schooling fish like herring and bass are known to forage near tidal fronts, and note how those patterns shift with seasons. This knowledge can inform safer routing for trips and avoid sensitive time windows. Effective gear choices, such as robust mooring systems and corrosion-resistant hardware, reduce maintenance demands in harsh offshore conditions. In particular, consider gear compatibility with the local marine fauna to minimize disturbance while maintaining solid performance over the project lifecycle.
Operational practicality matters as much as the science. Distill the data into a final shortlist, and present a transparent, element-by-element comparison. Don’t rely on a single metric; instead, assemble a composite index that weighs energy density, ease of installation, access for boats and rigs, environmental constraints, and maintenance risk. This final step lets you pick a particular site with confidence, ready for detailed design and permitting processes. The final decision should reflect a balance between high energy yield and feasible operations, ensuring a sustainable path from exploration to development.
In practice, one favourite workflow combines field verification with a simple, repeatable mapping approach. Start with a solid, data-driven filter to identify candidates, then expand into seasonal campaigns that tighten estimates of energy density and installation risk. The knowledge gained from each trip builds a practical picture you can relate to both engineers and operators. The result is a plan that could scale across locations, keeping a clear line from data to decision while maintaining a pragmatic focus on execution at each stage. This approach helps you learn faster, reduce uncertainty, and improve performance as you move from site selection to deployment.
Ultimately, the final map and site report should be clear, actionable, and portable for field crews. Include a concise set of recommendations, a transparent justification, and a well-defined data appendix. Your analysis should tell the story of why a site is suitable, what risks exist, and how you will manage them through the life cycle. That clarity makes the difference between a promising concept and a solid, bankable project that aligns with environmental and logistical realities. Remember: the best sites are those where knowledge translates into reliable, repeatable results, and where the gear and operations are tuned to the particular conditions of the tidal environment.
Example of a practical outcome: a shortlist of 3 sites with their final scores, a plan for two initial trips per site to validate current profiles, a proposed gear configuration for anchor stability, and a risk register focused on accessibility, weather windows, and ecological constraints. The favourite choice should be the one that blends robust energy yield with manageable field operations, while keeping ecological and community considerations in view. This approach ensures a clear path from resource mapping to successful installation and long-term performance.
Technology options: tidal turbines, lagoons, and hybrid approaches
Deploy a modular tidal-turbine array in an inshore creek channel with multiple spots facing incoming tides, paired with a compact lagoon to store energy and level loads. This hybrid setup delivers reliable output and flexibility through seasonal swings while keeping maintenance and retrieval work manageable.
Tidal turbines
- Principle: capture energy from fast, predictable currents in inshore channels and creek mouths; group turbines to reduce wake losses and maximize delta flow efficiency.
- Layout: place turbines in evenly spaced backs along the channel; select spots with current velocity above a threshold to avoid excessive scour; use weighted sensors to monitor performance and salinity changes across the lagoon interface.
- Operational data: capacity factors at high-flow sites typically range from the mid-20s to the low-40s percent; incoming tides create peaks in output; retrieval operations occur during slack water to minimize vessel time; maintenance windows can be scheduled twice yearly in low-activity seasons.
- Fisheries interaction: early studies track fish patterns around turbine arrays; zman data from creek surveys help identify spots with high activity; implement exclusion zones for walleye and minnow habitats as needed.
Lagoons
- Principle: enclose a portion of coastal water behind a natural bank to create a stable head; operate turbines or pumps to balance daily energy output; lagoons provide predictable cycles through tidal storage and controlled release.
- Site considerations: delta regions offer sheltered inshore lagoons with reduced storm exposure; salinity gradients influence species movement and ecological risk; install fish-passable gates to support creek connectivity.
- Economics and build-out: since capital cost is higher upfront, lagoons offer lower operating costs, higher lifecycle predictability, and the ability to stack storage options and multiple generation modes; typical projects target tens of MW in a single lagoon with modular expansions.
Hybrid approaches
- Strategy: couple tidal-turbine groups with a lagoon or battery storage to smooth output and provide grid services; use an integrated control system to switch between generation modes as tides shift through the day.
- Operational design: route incoming tides through turbines to capture velocity while diverting excess head into the lagoon for later release; this approach yields high capacity utilization across the day and across seasons; the group of devices can be scaled in multiples as demand grows.
- Environmental and fisheries planning: monitor salinity, creek connectivity, and patterns of fish movement; maintain back-channel corridors to support species like walleye and minnow; ensure retrieval of failed devices and safe passage for aquatic life; this reduces environmental risk and improves public acceptance.
Practical guidance for site selection
- Identify spots with strong flow and minimal sediment build-up; evaluate delta and creek networks to maximize energy capture; use sonar to map incoming flows and verify that the selected inshore zones will deliver steady power.
- Assess maintenance logistics: accessibility for retrieval of equipment; ensure spare parts inventory; plan twice-yearly maintenance windows for turbines and lagoon gates.
- Engage with fisheries stakeholders early; gather data from local minnow and walleye habitat surveys to minimize impacts and align with seasonal migrations.
Environmental safeguards: baseline studies and mitigation strategies
Here is the immediate recommendation: launch a 12-month baseline study of inshore and nearshore habitats to capture current patterns, stream speed, and overall activity before any device enters service. Document erratic movements and swimming behavior of key species, and establish a balance between energy testing and ecological protection. Include measurements of substrate colours to guide site adaptation and identify clear reference conditions for later comparisons. This baseline provides a reference here for future comparisons.
Coordinate a multidisciplinary program: hydrographic surveys to map currents and bathymetry, biological surveys to inventory species and habitats, and physical-chemical monitoring to track turbidity and oxygen. Through collaboration with local communities and other stakeholders, adopt practical approaches such as onshore observations and lightweight sensors. Local field teams, including yaks-based observers and grubz networks, provide seasonal coverage and community validation. Record data on main drivers: stream speed, currents, and their seasonal variability. This baseline data is very valuable to help relate findings to mitigation targets.
Mitigation measures reduce risk: maintain a tight ramp-up to avoid noise spikes; apply selective noise controls; set automatic shutdown thresholds when protected species are detected or currents exceed safe margins. Conduct regular retrieval drills and keep spare parts ready for fast repair. Use precise targeting to avoid heavy fishing zones and hotspots where baits are used. Extend protections along the coast to minimize bycatch. Maintain attention to vessel traffic and ensure clear maps guide access.
Establish a full, accurate data regime: document baseline in a shared, transparent format and maintain updates to reflect new measurements. Ensure retrieval of archived data and QA/QC checks to produce clear, actionable insights. relate environmental responses to current conditions and system operation, with ongoing inshore monitoring along coasts and estuaries. Track shifts in swimming patterns of local populations and verify that activity remains within safe bounds.
Grid integration and economics: transmission, storage, and incentives
Recommendation: launch a three-hub pilot pairing 40 MWh of storage per hub with 0.7 GW of transmission upgrades, and tie incentives to real-time performance metrics such as discharge reliability, response time, and losses avoided. This setup can cut annual curtailment by 18–26% in high-renewable seasons and reduce system losses by 5–8% in year one. Ensure dashboards are accessible across places where projects land and share the knowledge with operators, regulators, and local communities.
Grid integration requires choosing a co-optimized mix of transmission and storage. Implement weighted risk scoring to rank options, and use delta analysis to align forecasts with actual conditions. Use dynamic line ratings to exploit thermal margins more often and justify HVDC links on long corridors. Build cross-border interties where market benefits exceed permitting costs, and present a steady stream of data to support decisions on the side of the network where reliability is sensitive. The techniques here deliver lower marginal costs and more predictable energy delivery. Wind farms with blades turning in gusts create variability; the weighted approach helps smooth those swings and the team can throws contingency plans into the mix as conditions shift.
Storage economics hinge on a blended portfolio. Lean toward fast-response lithium modules for 4–6 hour windows and pair with long-duration options like pumped hydro where geography offers a natural basin. Costs are falling, soft costs are rising as EPC capacity expands, and current capex sits roughly in the $300–450 per kWh range depending on chemistry and scale. This creates plenty of room to optimize using modular installations. Each project improves performance metrics, including round-trip efficiency and cycle life. Techniques to maximize life–thermal management, smart charging, and robust BMS control–help reduce deltas between expected and actual results and keep the portfolio solid. Choosing the right mix also supports coastal places where wind and tide resources align with existing infrastructure, including trout-rich river basins that can host hybrid solutions with minimal additional land use.
Incentives and markets shape capital flows. Design a mix of energy payments, capacity payments, and reliability rewards with clear milestones. Use grubz-style micro-incentives to engage coastal communities and small operators, and run occasional tournaments among aggregators to spur price discovery. Build a strong presentation of results to banks and regulators to attract investment, and keep policy signals stable to reduce risk for developers and fishermen near ports who rely on steady power for cold storage and fish processing. Attracting investment hinges on visible performance, documented deltas between promise and delivery, and a transparent route to liquidity. On the side of the grid, attracting new participation expands opportunities for trips to service fleets, while keeping costs predictable for consumers.
| Scenario | Transmission (GW) | Storage (MWh) | Capex (USD B) | Payback (years) | Key incentives |
|---|---|---|---|---|---|
| Base case | 0.7 | 40 | 1.3 | 6–8 | Standard tariffs and existing subsidies |
| Incentivized case | 0.95 | 60 | 1.8 | 5–7 | Performance payments, capacity payments |
| High renewables | 1.2 | 100 | 2.6 | 4–6 | Grubz micro-incentives; tournaments |
Solid governance, transparent metrics, and timely data sharing ensure projects scale efficiently. This framework supports users, operators, and communities alike, enabling steady, resilient operation while expanding opportunities from transmission, storage, and incentive design.
Saltwater lakes fisheries: species, gear, and sustainable harvest practices
Set seasonal closures and use size-selective gear to protect juveniles and ensure recruitment. This approach provides stable yields and preserves ecosystem functions in saltwater lakes located in arid regions. Establish a single, transparent quota per lake and adjust with CPUE data to keep effort tight and manageable.
Species in inland salt lakes vary with salinity and inflows. Artemia franciscana cysts dominate many systems and provide a steady food source for hatcheries and local markets, giving fishers an opportunity to diversify income. Salinity varies between 20 and 250 ppt, and four main habitat zones support different targets. In lower-salinity margins, small fish and mollusks often occur; in deeper, more saline pools, brine shrimp dominate and attract attention from buyers. The variety of life forms attracts attention from communities, and the scent of brine can signal productive pockets. The colours of shells and skins look vivid in the right light, and favourite targets shift with season, so adapt gear and timing accordingly.
Gear choices emphasize safety and selectivity. For fish, use gillnets with mesh sizes of 25–40 mm to catch adults while allowing juveniles to escape; fyke nets and trap nets sized 50–120 mm can harvest larger individuals with minimal bycatch. For crustaceans and mollusks, employ fine-mesh scoop nets or hand-picking in shallow bays and use baskets to reduce loss. Set gear at dawn and retrieve within tight windows to reduce stress on wildlife. Keep the presentation of the gear simple and well-marked to improve compliance and avoid conflicts.
Harvester practices require ongoing monitoring. Limit daily and seasonal effort and document bycatch; track weight per area, and reallocate effort if CPUE declines. Protect at least 20% of critical habitats by establishing no-catch zones; use evidence from catch logs to adjust rules. Ensure ports and markets reflect the real value of the catch, and confirm that the fishery remains sustainable moving forward. The system should be flexible to vary with rainfall, inflows, and salinity shifts so that the fishery remains resilient. In remote markets, yaks transport the haul from camps to towns, highlighting the need for thoughtful transport planning to maintain freshness and presentation.